pH-dependent water permeability switching and its memory in MoS₂ membranes
A second collaboration with Rahul Nair’s group at Manchester’s National Graphene Institute, this time with Kostya Novoselov’s group as well, and again the sequence was that the experimentalists found something striking and wanted a mechanism for it rather than a description of it. Their membranes did not simply switch between passing water and blocking it. They remembered which state they had last been in, and the memory was robust enough to survive ten cycles without measurable degradation. Hysteresis in a transport property is common in biology and rare in a synthetic laminate, and it is not the sort of behaviour a static structural picture accounts for.
Angelos Michaelides and I designed the ab initio molecular dynamics; I ran and analysed it with him. Everything experimental is Manchester’s, as is the classical molecular dynamics of water entry, which was done at Dalian.
The phenomenon
Membranes are assembled by vacuum filtration from MoS₂ flakes exfoliated by lithium intercalation, giving free-standing laminates 0.5–2 µm thick. Exfoliation this way leaves the flakes in the metastable 1T′ polymorph, which carries surface charge and retains intercalated lithium; annealing converts them towards the ordinary semiconducting 2H phase.
The two polymorphs behave completely differently. A 1T′ membrane passes water. A 2H membrane does not, and as the 2H fraction rises with annealing temperature the permeation falls monotonically until, above about 90% 2H, it drops below the detection limit.
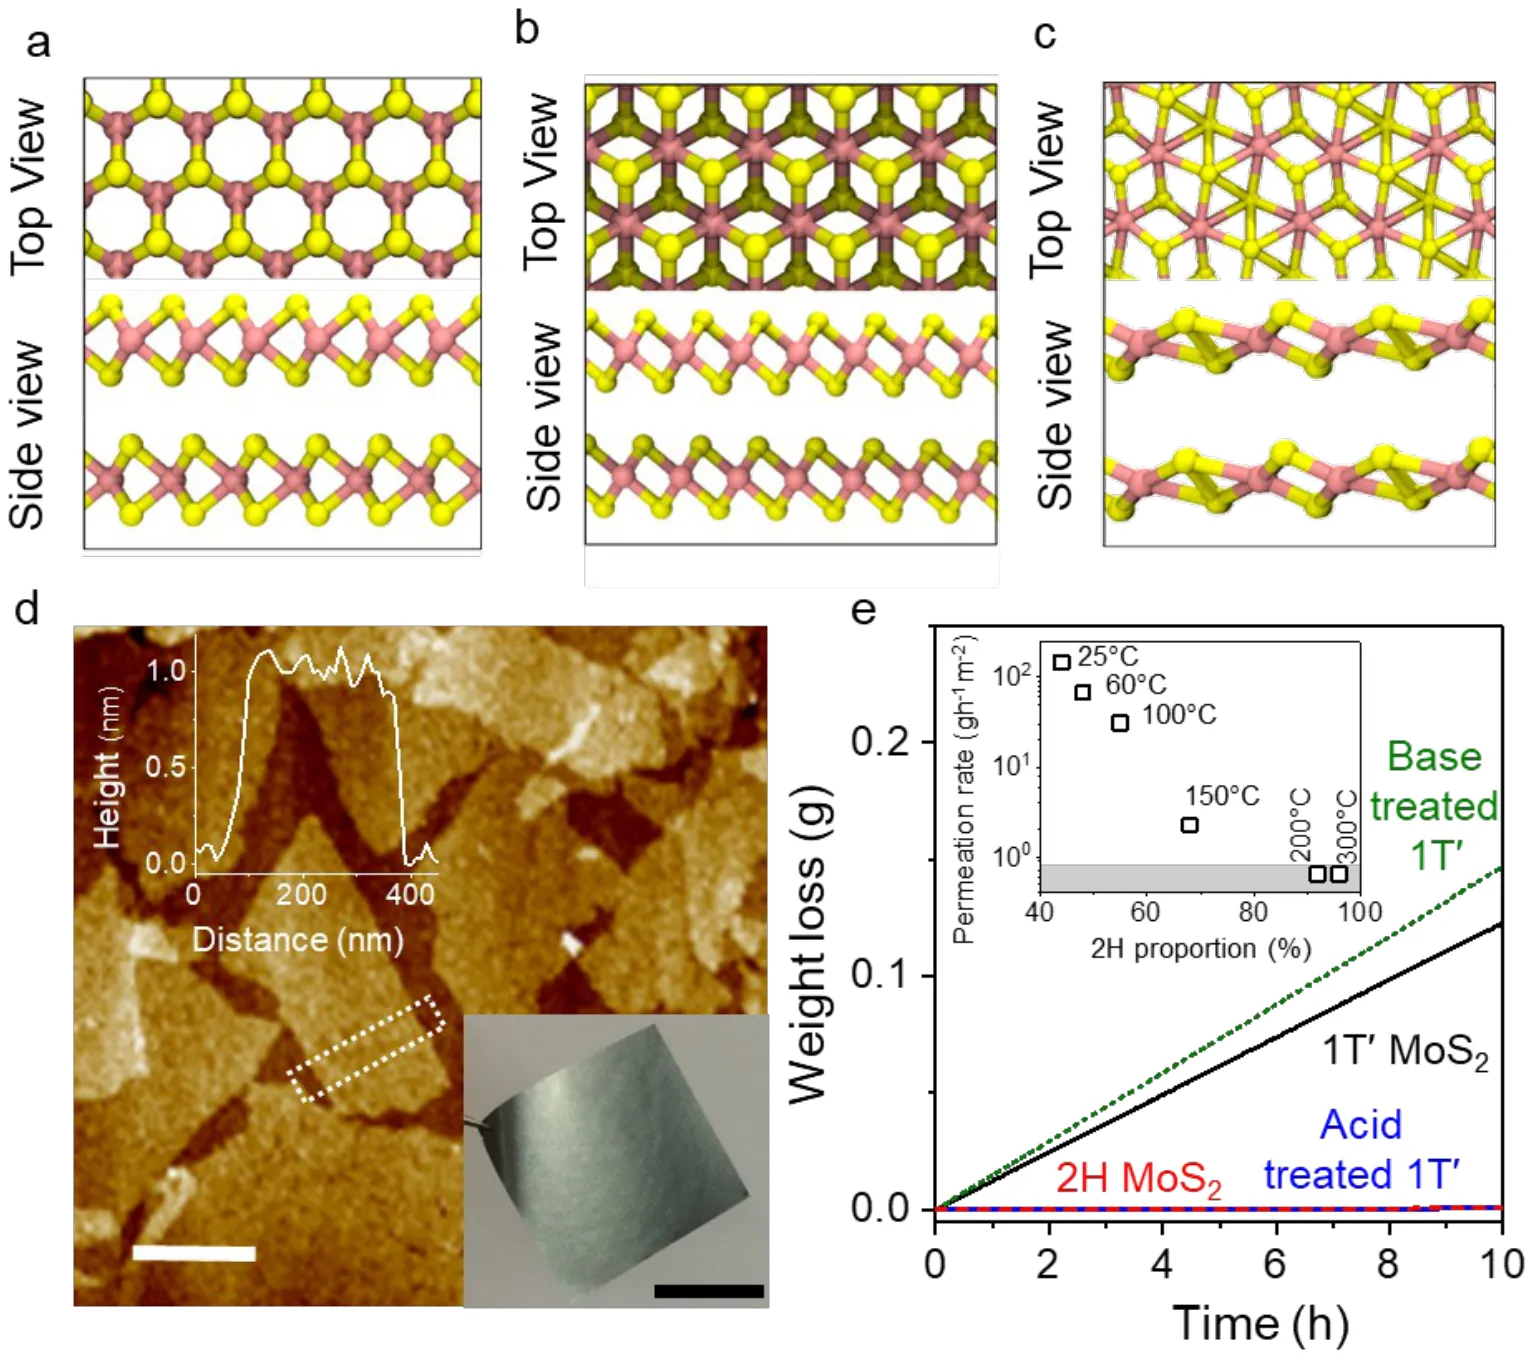
The membranes and the basic result. Panels a–c show the three MoS₂ polymorphs; d is AFM of the exfoliated flakes with a ~1 nm height profile and a photograph of a 2 µm free-standing membrane. Panel e is the permeation measurement, weight loss from a sealed water-filled container, for as-prepared 1T′, 2H, and acid- and base-treated membranes, with the inset showing permeation collapsing as annealing converts 1T′ to 2H.
Fig. 1 from Hu, Achari, Rowe et al., Nature 616, 719–723 (2023). Accepted manuscript, CC BY.
The interesting behaviour appears when the 1T′ membrane is conditioned at different pH. Water vapour permeation switches by a few orders of magnitude, and the switch does not retrace its path. Taking a membrane up from pH 1 it stays shut until about pH 11; bringing it back down it stays open until about pH 4. Liquid permeance shows the same loop, running from below the 0.01 L m⁻² h⁻¹ bar⁻¹ sensitivity limit after acid treatment to 1.1 L m⁻² h⁻¹ bar⁻¹ after pH 12.1, and so does sodium ion permeation against feed pH.
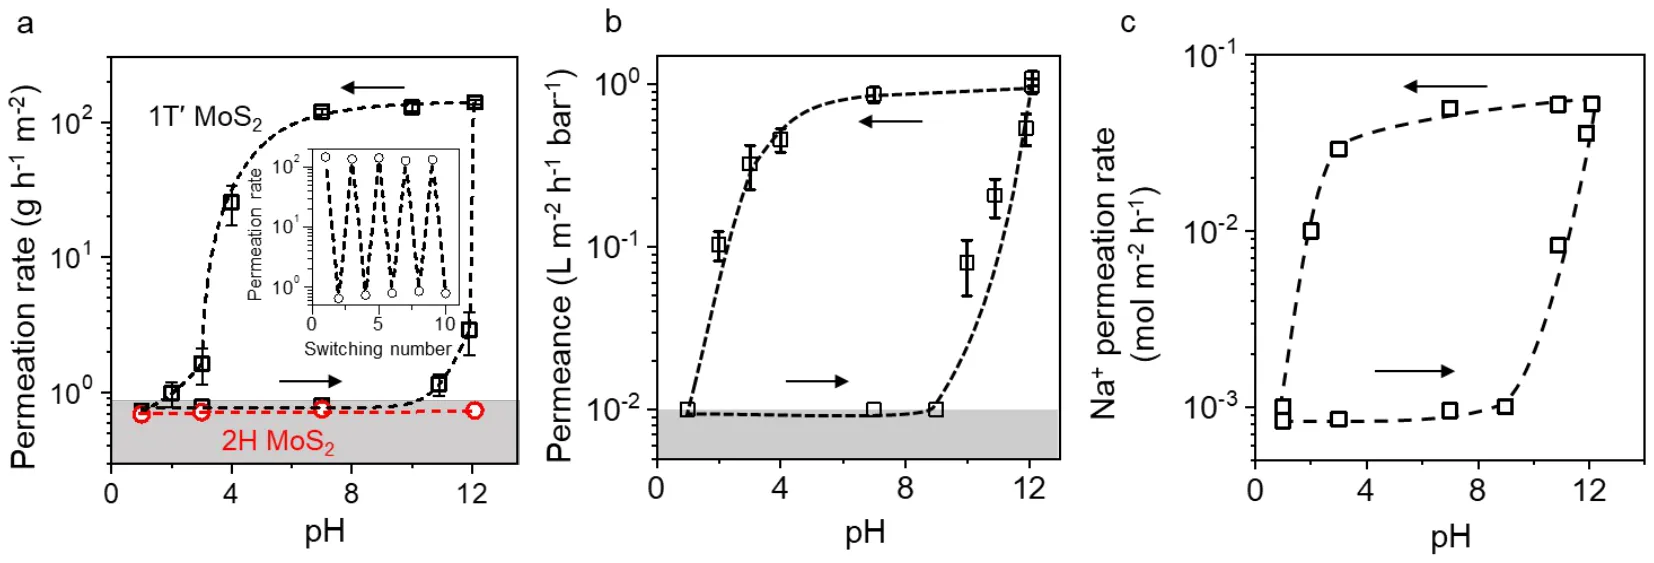
The result the paper is built on. Water vapour permeation (a), liquid water permeance (b) and Na⁺ permeation (c) against pH, with arrows marking the direction of the pH sweep. All three trace open loops rather than single-valued curves: the membrane’s state depends on its history, not only on its present conditions. The inset in (a) is ten reversible acid–base cycles with no measurable degradation.
Fig. 2 from Hu, Achari, Rowe et al., Nature 616, 719–723 (2023). Accepted manuscript, CC BY.
What the structural characterisation established
X-ray diffraction gives an interlayer spacing of 11.4 Å for pristine and base-treated 1T′, consistent with two intercalated layers of water, against 6.4 Å for 2H and for acid-treated 1T′. So acid treatment collapses the gallery, and the collapse is reversible.
The obvious explanation would be that acid drives the 1T′ flakes back to 2H, but X-ray photoelectron spectroscopy rules that out. The 1T′ fraction changes only modestly on acid treatment, from 56% to 46%, which is far too small to account for a switch of several orders of magnitude. What does change is the S 2p line: it shifts 0.5 eV to higher binding energy and can only be fitted self-consistently by adding an S–H component at 161.8 eV carrying 16% of the intensity. The mechanism is protonation of surface sulfur, which neutralises the 1T′ surface charge, expels the intercalated lithium and lets the layers collapse.
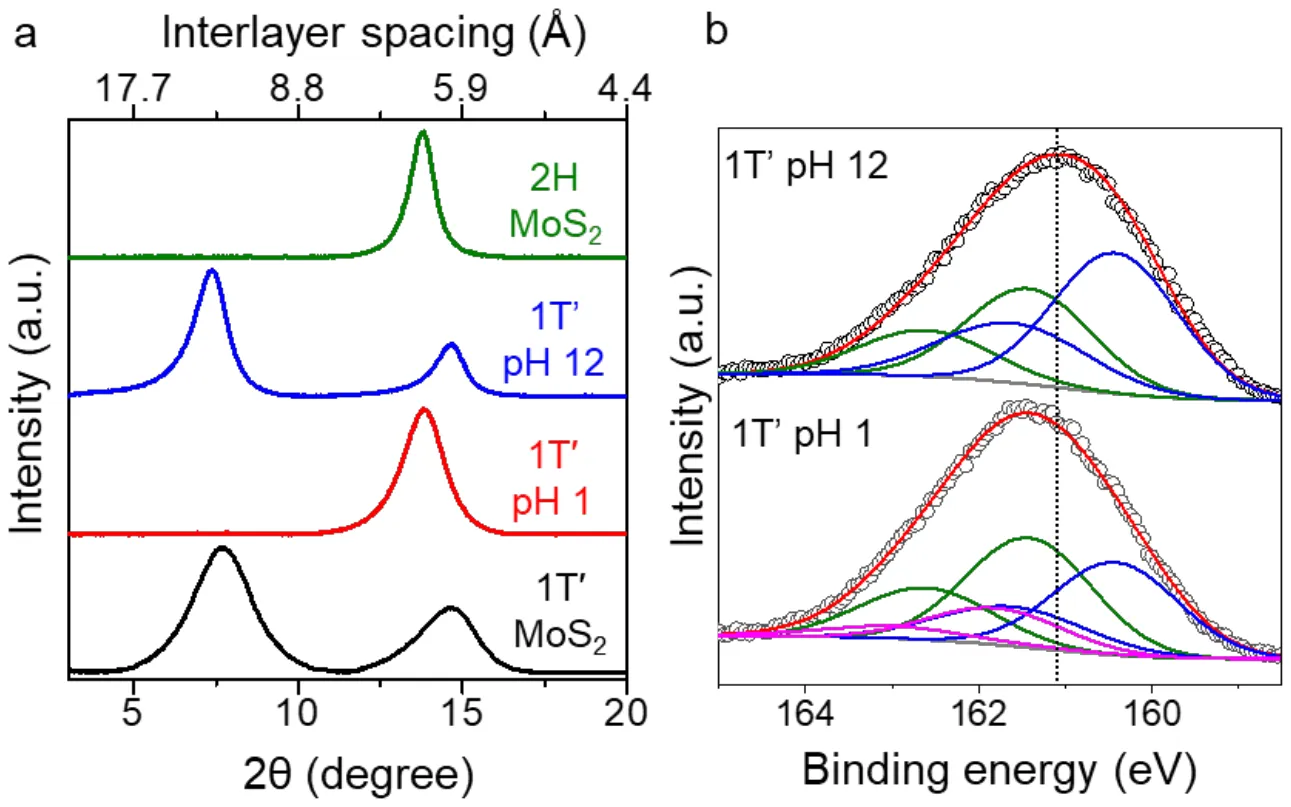
Structure and chemistry behind the switch. XRD (a) puts the interlayer spacing at 11.4 Å for the open state and 6.4 Å for the closed one. The S 2p photoelectron spectra (b) separate the two candidate mechanisms: the 1T′ and 2H components barely move, while an S–H component appears on acid treatment. Protonation, not a phase transition.
Fig. 3 from Hu, Achari, Rowe et al., Nature 616, 719–723 (2023). Accepted manuscript, CC BY.
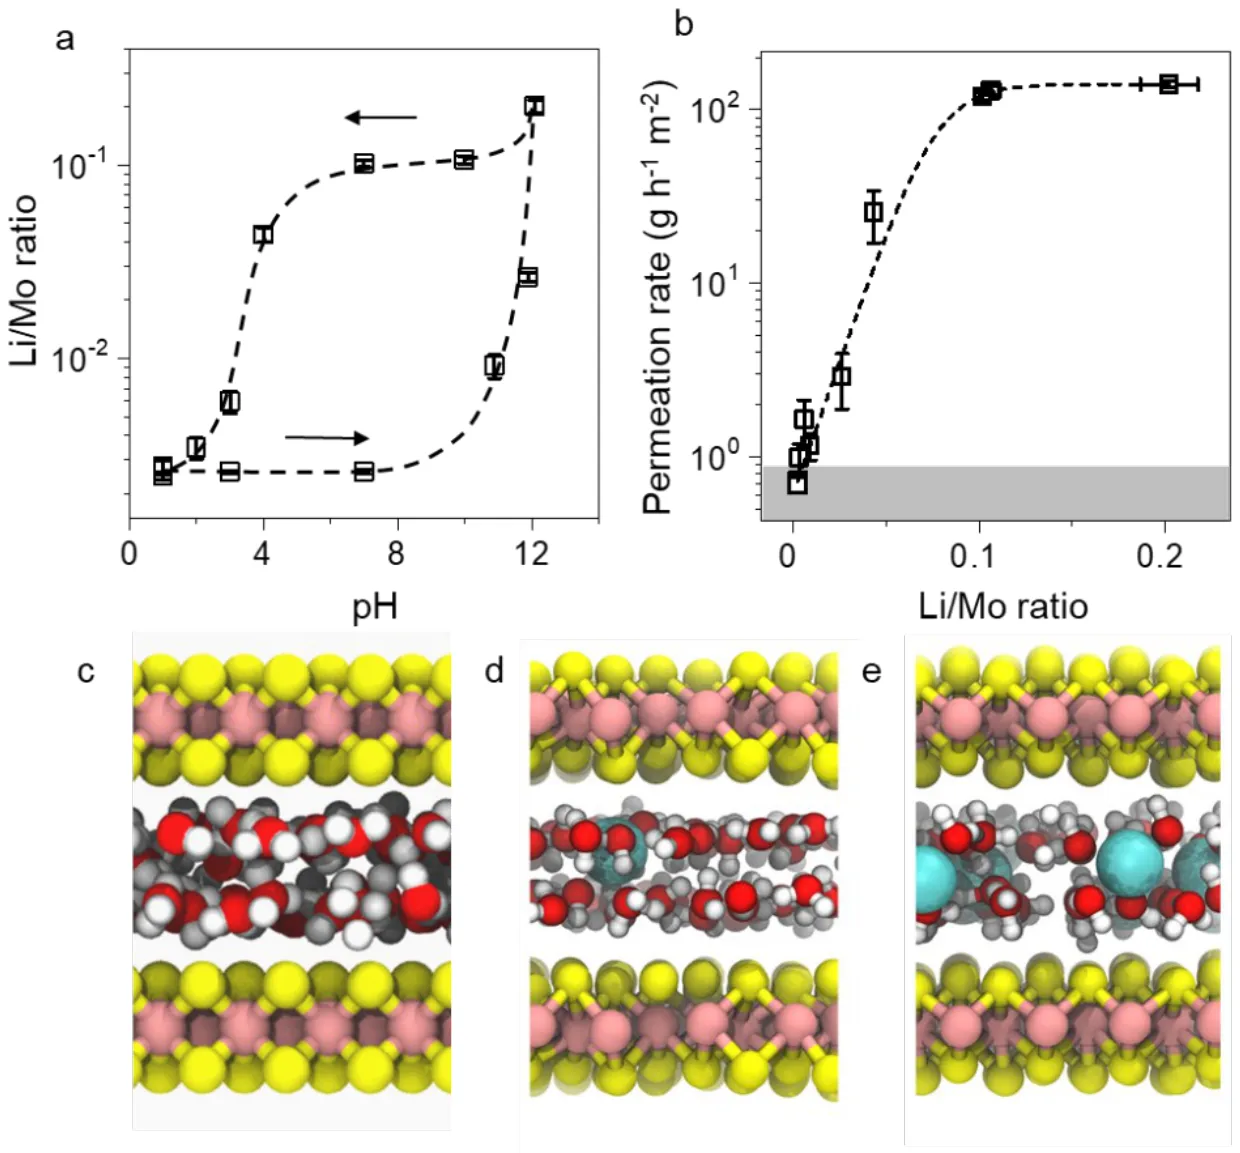
Elemental analysis closes the loop. Pristine membranes hold up to 0.3 mmol of lithium per gram of MoS₂, the lithium content traces the same hysteresis against pH as the permeation does, and permeation is high above Li/Mo ≈ 0.1 and falls sharply below it. Lithium content is the state variable the membrane remembers.
What the simulations were for
That leaves a specific question the experiments could not answer directly. Lithium content controls permeability, but does it do so by changing how fast water moves once it is inside the channel, or by controlling whether water gets into the channel at all? Those are different physical pictures with different consequences, and they are indistinguishable in a macroscopic flux measurement.
The ab initio molecular dynamics was designed to test the first of them. CP2K at optB88-vdW with a 550 Ry cutoff, cells of roughly 500 atoms containing around 105 water molecules and 1–16 lithium atoms at a fixed ~1 nm interlayer separation, pre-annealed with classical dynamics and then run for 20 ps of production at 400 K. Four systems: the 2H polymorph, the 1T′ polymorph, and 1T′ at Li/Mo = 0.02 and 0.3, spanning the range over which the experiment switches.
Confined water forms a well-defined bilayer in every case, and it is remarkably insensitive to what it is confined by. The 2H and 1T′ polymorphs have very different Mo–S and Mo–Mo bond length distributions, 1T′ being broad and bimodal as the metal sublattice continuously reorganises, and yet the water structure between them is almost identical. Water sits preferentially directly above sulfur atoms rather than in the interstitial sites, which indicates hopping rather than continuous diffusion.
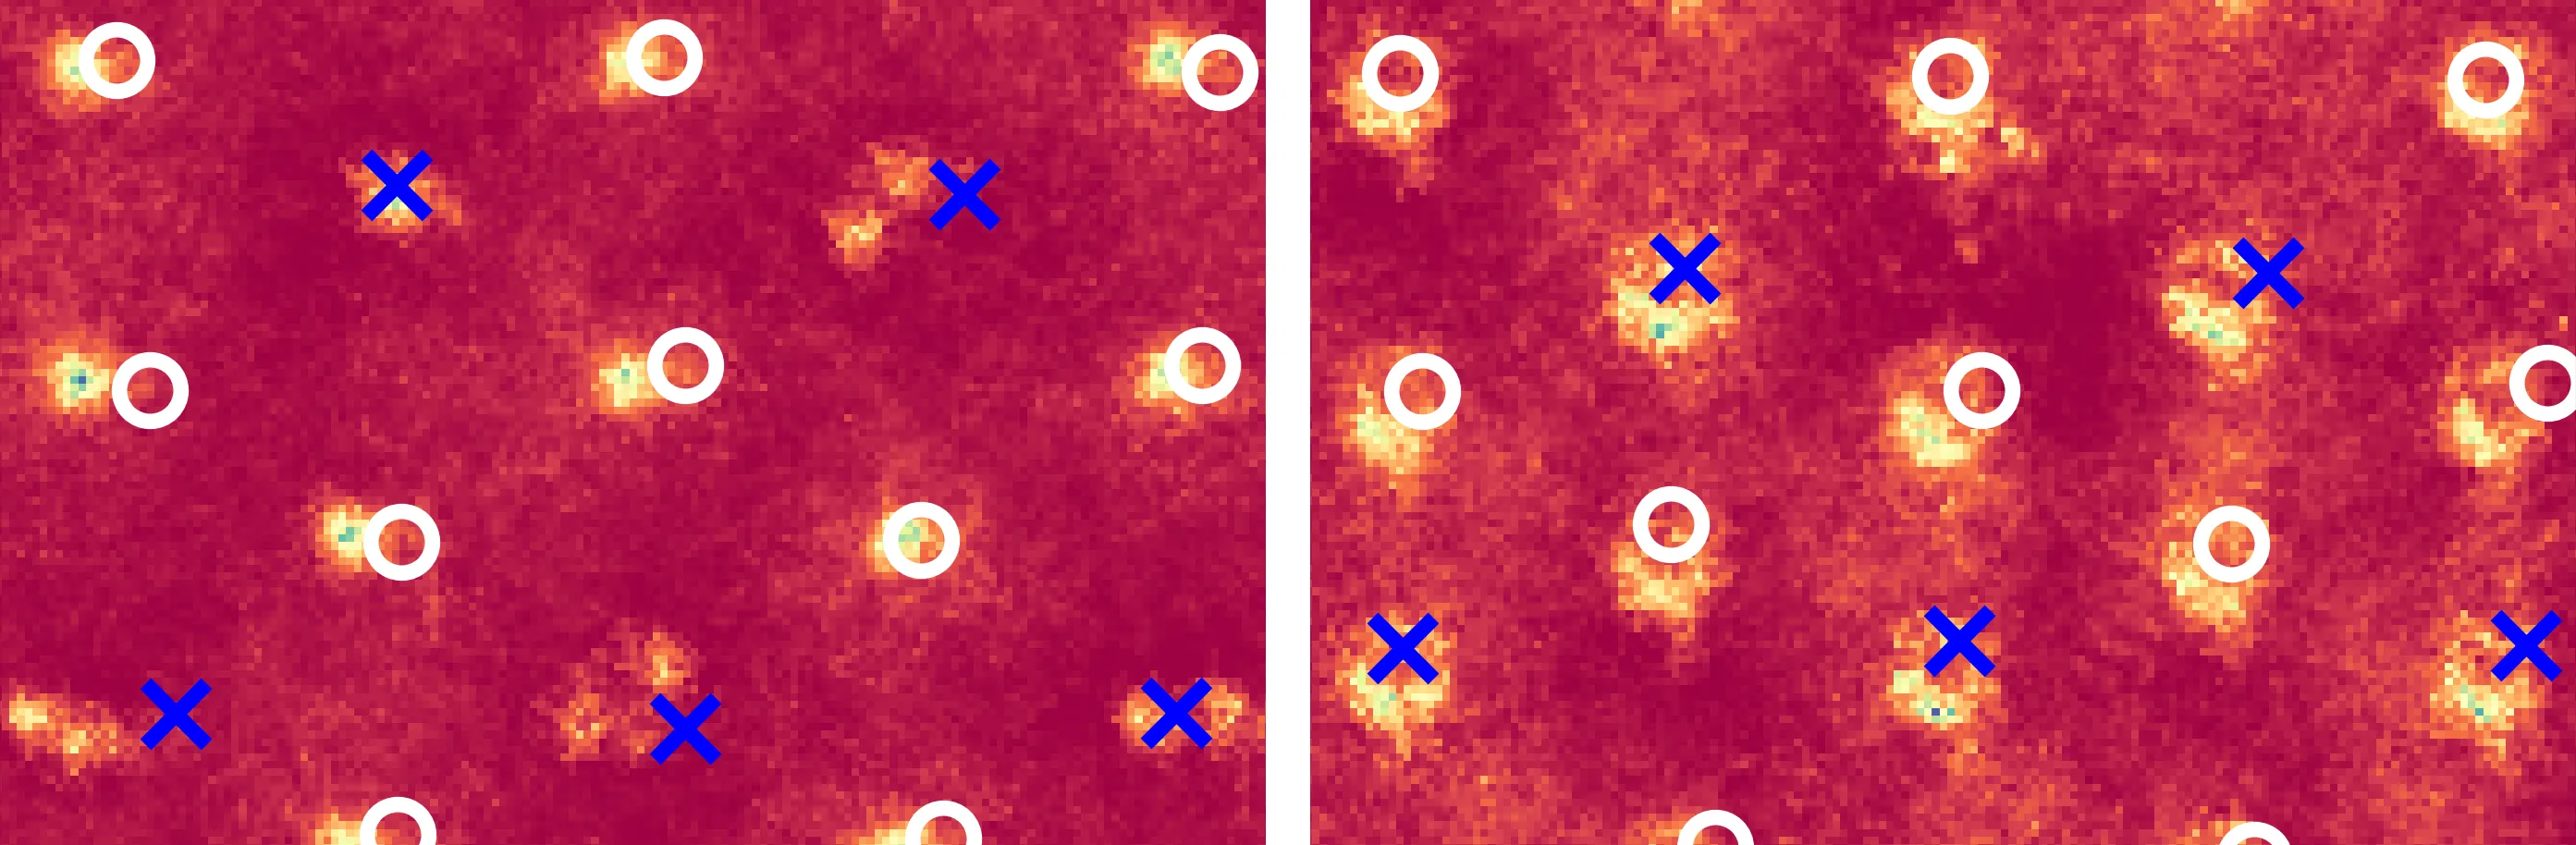
Where the water actually sits. In-plane probability density of the water oxygens across the MoS₂ basal plane at low (left) and high (right) lithium loading, accumulated over the production trajectory, with the molybdenum (blue ×) and sulfur (white ○) lattice positions overlaid. Density collects on lattice sites and stays flat in between rather than spreading evenly across the plane. Water occupies discrete positions and moves between them, which is the structural signature behind the hopping picture.
Own work, from the CP2K trajectories behind Fig. 4. Not published at this resolution; the on-image legend has been cropped away and its key moved into this caption.
Lithium loading does change the interfacial structure. At low Li/Mo the ions sit close to the MoS₂ surface; at high loading they localise between the two water monolayers, and the water molecules reorient so their hydrogens point at the surfaces instead.
It does not change the dynamics. The mean squared displacement of the water oxygens is essentially identical at Li/Mo = 0.02 and 0.3, across a range over which the measured permeability changes by orders of magnitude.
That is a negative result and it is the useful one. Whatever the membrane is doing, it is not modulating the diffusivity of water inside an already-open channel. The switch has to be in whether the channel opens at all, which is what the accompanying classical simulations of water entry address, and what the lithium-driven collapse from 11.4 Å to 6.4 Å describes.
Where this sits
The membranes and the weight-loss permeation apparatus come from Manchester’s own earlier work on lithiation-exfoliated MoS₂ laminates and on 2D-material membranes more generally, including the group’s studies of ionic sieving and desalination through functionalised MoS₂.
On the simulation side the work sits in the Michaelides group’s line on nanoconfined water: the optB88-vdW functional used here is Klimeš, Bowler and Michaelides’ own, and bilayer water, ice-like confined phases and hopping diffusion are recurring subjects in that group. It is also the second Manchester collaboration of the same shape as the vermiculite membranes work three years earlier: an experimental group with a clean anomaly, and simulations run to distinguish between candidate mechanisms rather than to reproduce the measurement.
Data availability is by request to the corresponding authors; no repository or dataset DOI accompanies the paper. The published figures reproduced here are from the CC BY accepted manuscript deposited at Manchester, not from the version of record, which is behind a subscription. The in-plane density map is my own, from the trajectories themselves.